Three measurable indicators — Dk stability, dissipation factor, impedance control — and the documentation that proves them before you commit a program.
High-frequency PCBs span 5G infrastructure, radar, satellite payloads, and automotive electronics, and at these frequencies board quality decides signal integrity more than component selection does. The market’s problem is that quality is invisible on a quote sheet: two boards with identical stackups can perform a decade apart in dB. For engineers, OEMs, and procurement teams, three measurable indicators separate the suppliers who can hold performance from those who only promise it.
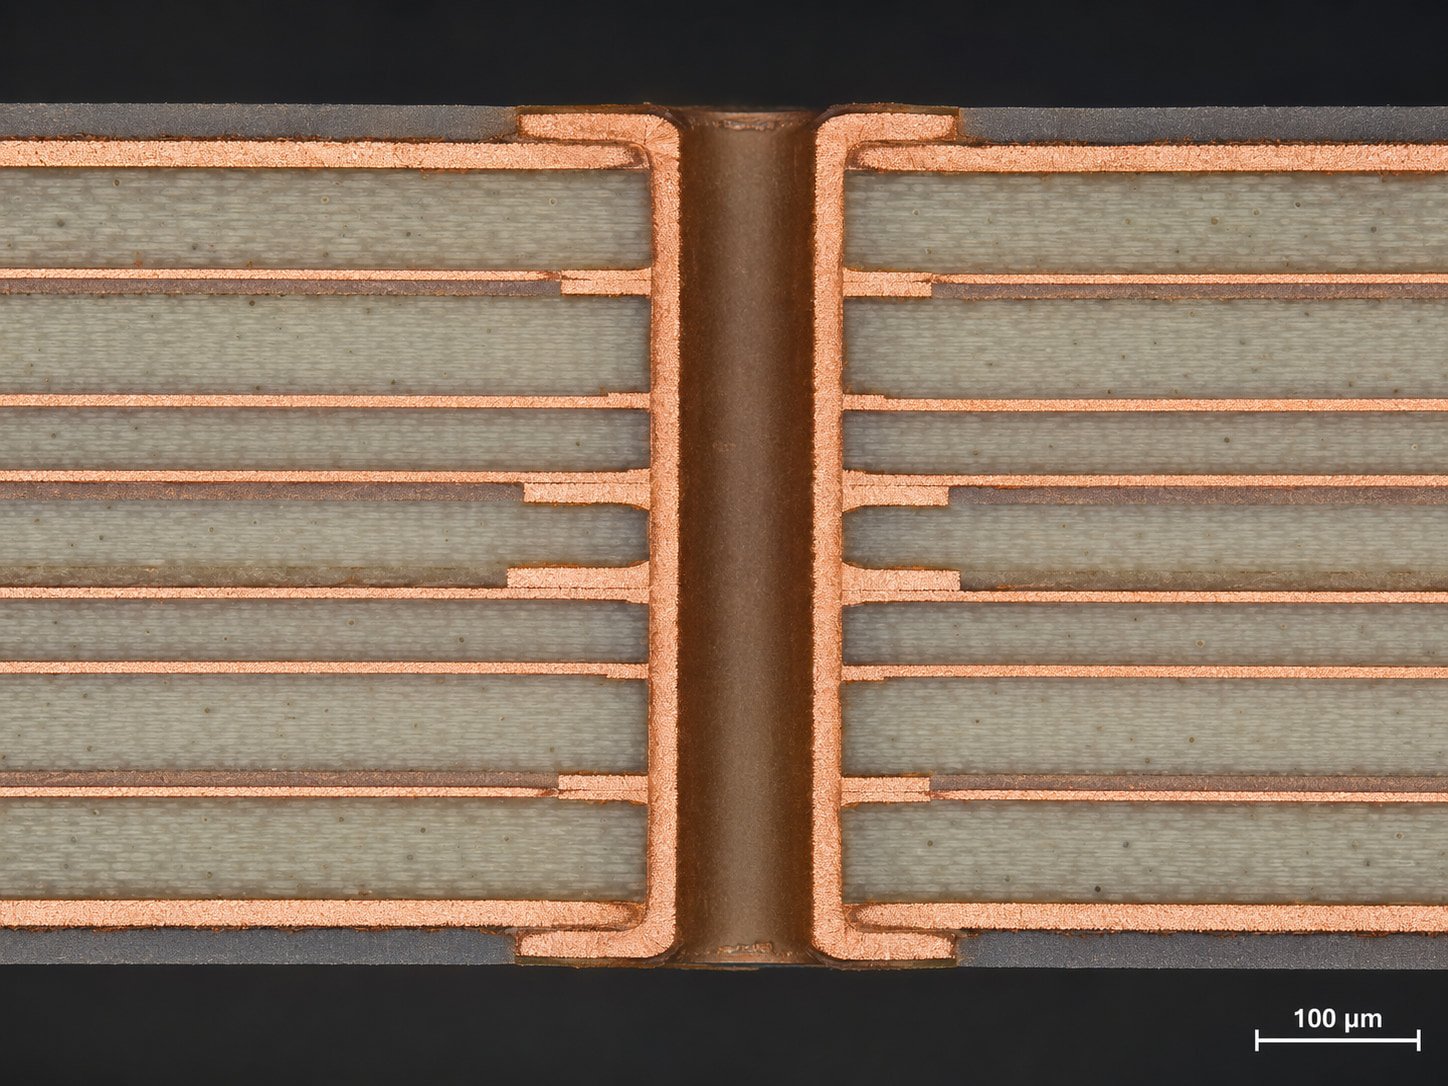
Dk governs how signals propagate, and its stability — across frequency, temperature, and production lots — determines whether impedance stays where the design put it. Stable materials deliver lower signal delay variation, better phase consistency, and minimal insertion loss; unstable ones convert every thermal swing into a re-tuning exercise. Published industry research consistently shows that dielectric-grade materials cut insertion loss in 5G mmWave systems by double-digit percentages.
Ask any candidate supplier for four artifacts: the laminate datasheet, frequency-dependent Dk test reports, thermal stability data, and third-party laboratory certification. Premium PTFE and Rogers-class laminates hold Dk in the 2.2–3.5 range with very small variation — anything looser shows up first as phase error in antenna work. A manufacturer who documents batch consistency is telling you their process control extends beyond the press; the full verification chain is detailed in our testing-process walkthrough.
Df measures how much signal energy converts to heat in transit, and at RF frequencies small differences compound quickly. For microwave work, look for Df at or below 0.001; advanced designs tolerate up to 0.003. Beyond that, the costs arrive quietly — attenuated signals, degraded antenna efficiency, rising insertion loss, and link instability that no amplifier budget can fully buy back. The materials that clear the bar are PTFE-based laminates, ceramic-filled hydrocarbons, and the flagship Rogers and Taconic grades compared throughout our materials guide.
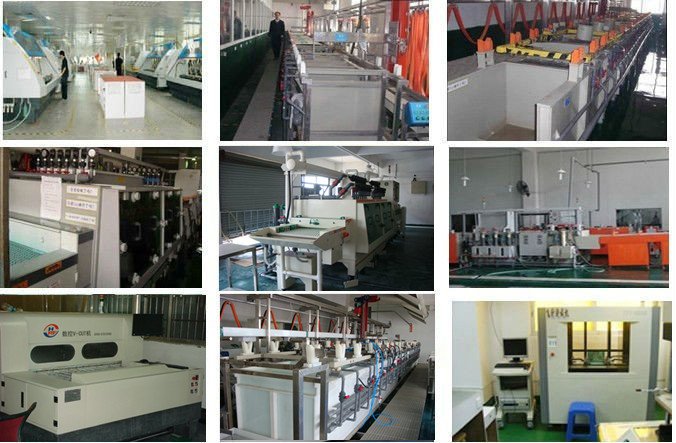
Impedance is where design intent meets manufacturing precision. A typical RF stack specifies 50 Ω single-ended and 100 Ω differential targets; when tolerance drifts past ±5%, reflections, EMI, and transmission instability follow. Top-tier manufacturers hold ±2% — and the difference between those numbers is visible in the factory, not the datasheet: laser drilling, precision etching, automated impedance testing, and strict layer-to-layer registration.
Before committing a program, request TDR test reports, impedance coupon data, manufacturing capability statements, and process control certifications. These documents do more than demonstrate the three indicators — they show whether the supplier can reproduce them across lots, which is the property your field failure rate actually depends on. The reliability-test methods behind long-term consistency are covered in our reliability testing analysis, and the structural traps behind failed boards are cataloged in our defect prevention guide.
Source high-frequency PCBs the way you would qualify any critical component: on measured engineering data. The shortlist — stable Dk, low Df, tight impedance control, and demonstrated production consistency — fits on one audit checklist and predicts system reliability better than any price comparison. When domestic laminate options enter the evaluation, the trade-off landscape is mapped in our domestic materials gap analysis. Choose the partner who can show the data, and the three indicators take care of themselves.
Frequently Asked Questions
Dielectric constant stability, low dissipation factor, and precise impedance control, supported by documented process consistency across production lots.
Because unstable Dk shifts impedance and phase with temperature and frequency, producing signal distortion and unpredictable transmission.
±5% is the commercial baseline; top-tier manufacturers demonstrate ±2% with TDR coupon data on your stackup.
Laminate datasheets, frequency-dependent Dk/Df reports, thermal stability data, TDR impedance reports, and third-party laboratory certification.
Send your application and quality requirements and we will return the test documentation package behind our Dk, Df and impedance claims.
Get a Fast Quote Fast Reply on WhatsApp